Keypad Data Display Solutions
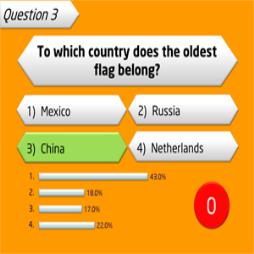
During events, data which is collected by keypads is able to be displayed in a number of different ways. Most often data is demonstrated as bar graphs, pie charts and scatter graphs. These can be labelled with either percentage or actual numbers of votes. Additional information is also able to be displayed such as average values.
Visit the Votech Ltd website for more information on Keypad Data Display Solutions
ENQUIRY FORM